 CardioRisk
Overview
Designing CardioRisk, a heart risk score anyone can read
Client project. CardioRisk estimates a person's 10-year risk of heart disease from 15 routine readings, with a model trained on the Framingham Heart Study. We audited the working app, then redesigned the brand, the website and the app so a clinician can trust the result and explain it.
- Logo, colour, type, imagery, risk and interface
- 14 guideline slides
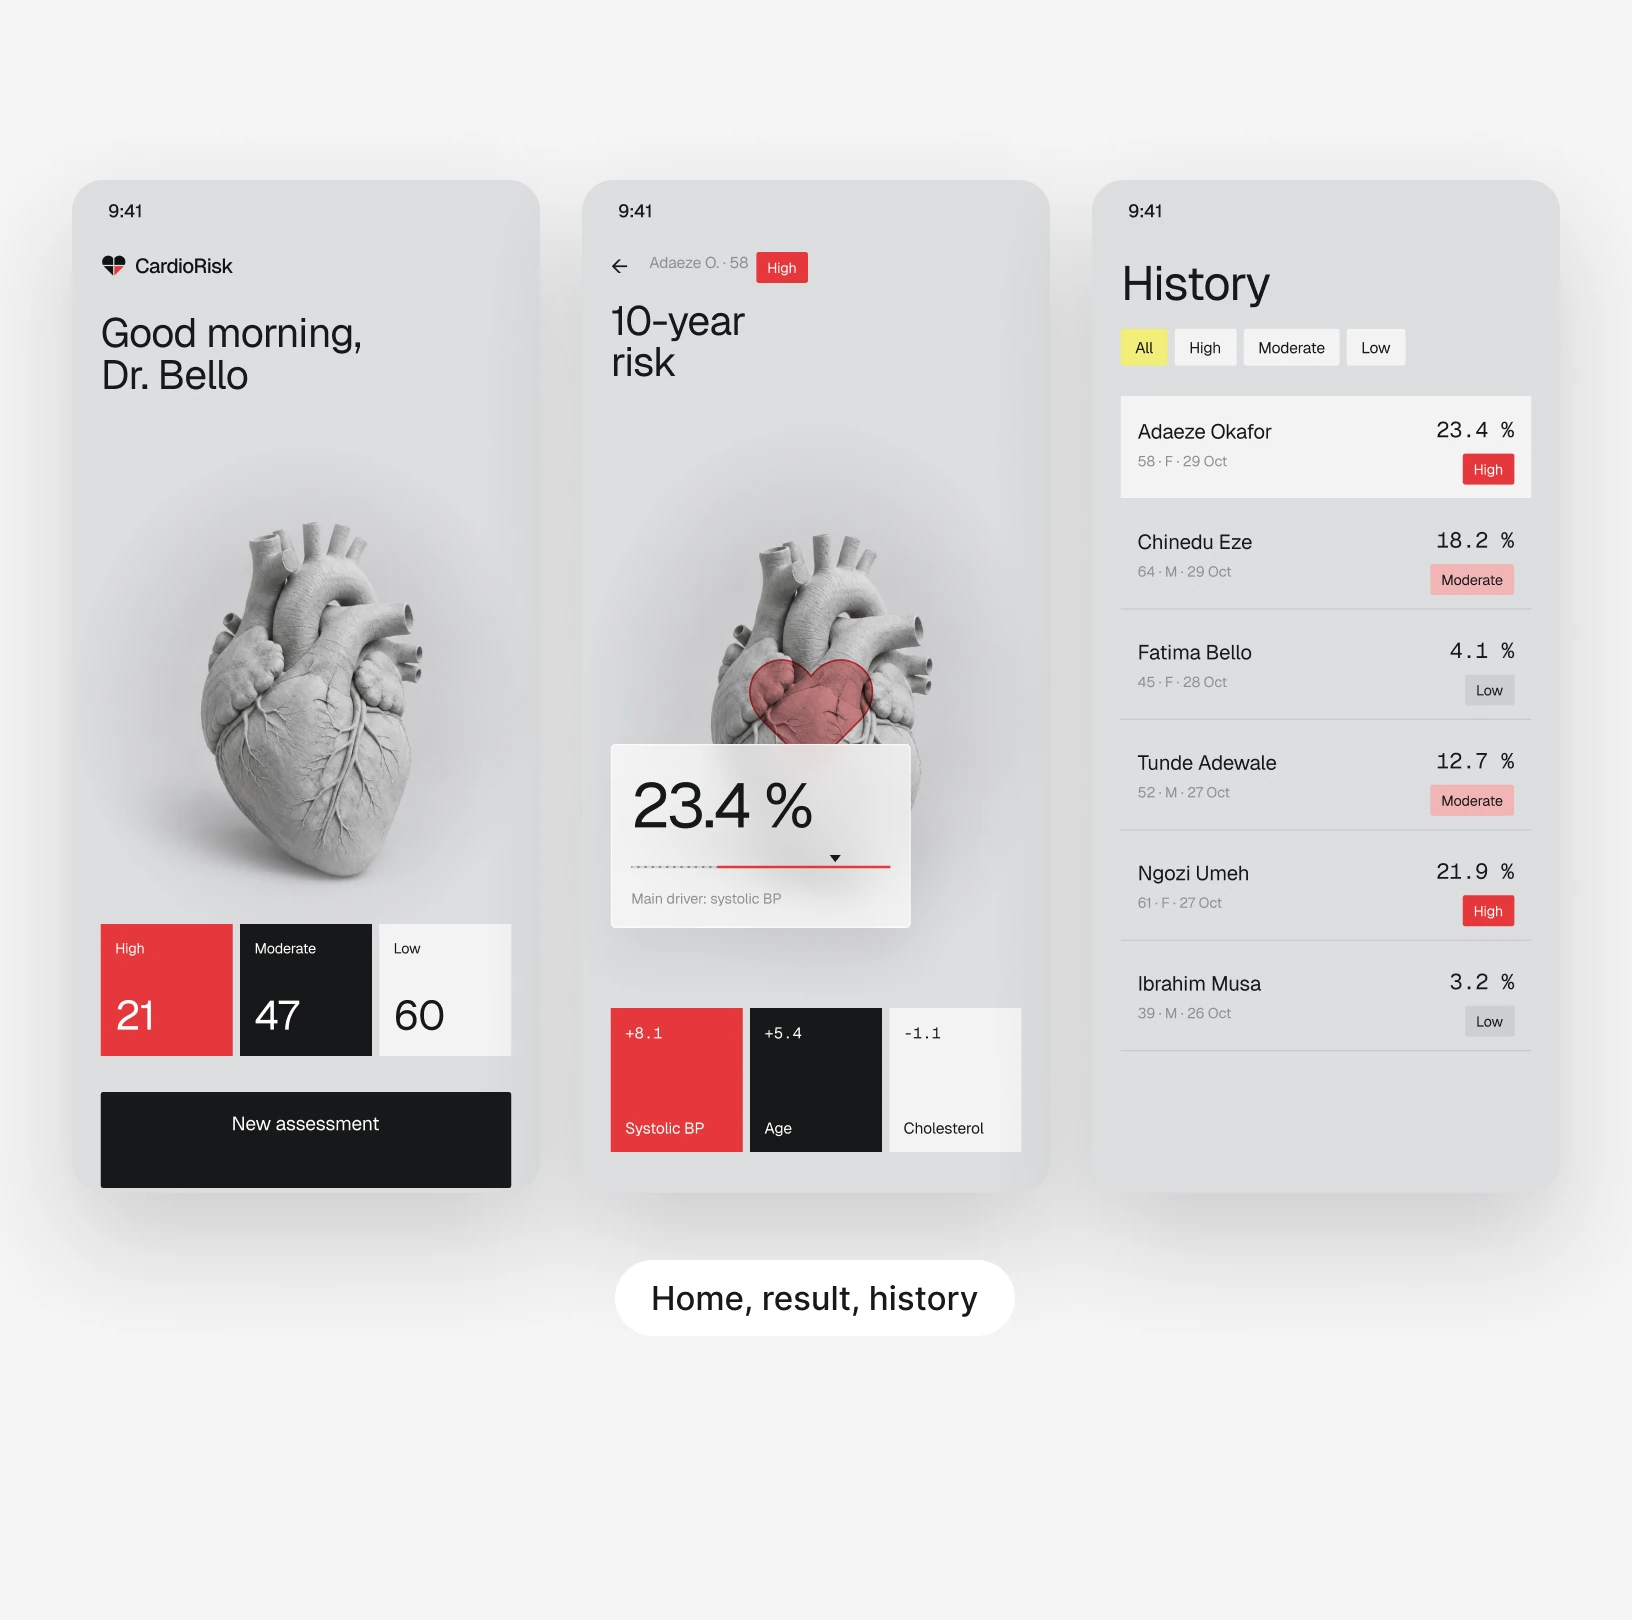
- 3 desktop and 4 mobile, from assessment to history
- 7 app screens
- A home page that explains before it asks
- 1 website
Status
Designed. A redesign of the brand, website and app. The risk bands still need a clinician's sign-off.
CardioRiskClient project · 2026
What we did
- Product audit
- Brand identity
- Brand guideline
- Website
- Web app
- Mobile app
- Data visualisation
The redesign
From a final year project to a tool a clinician would trust.
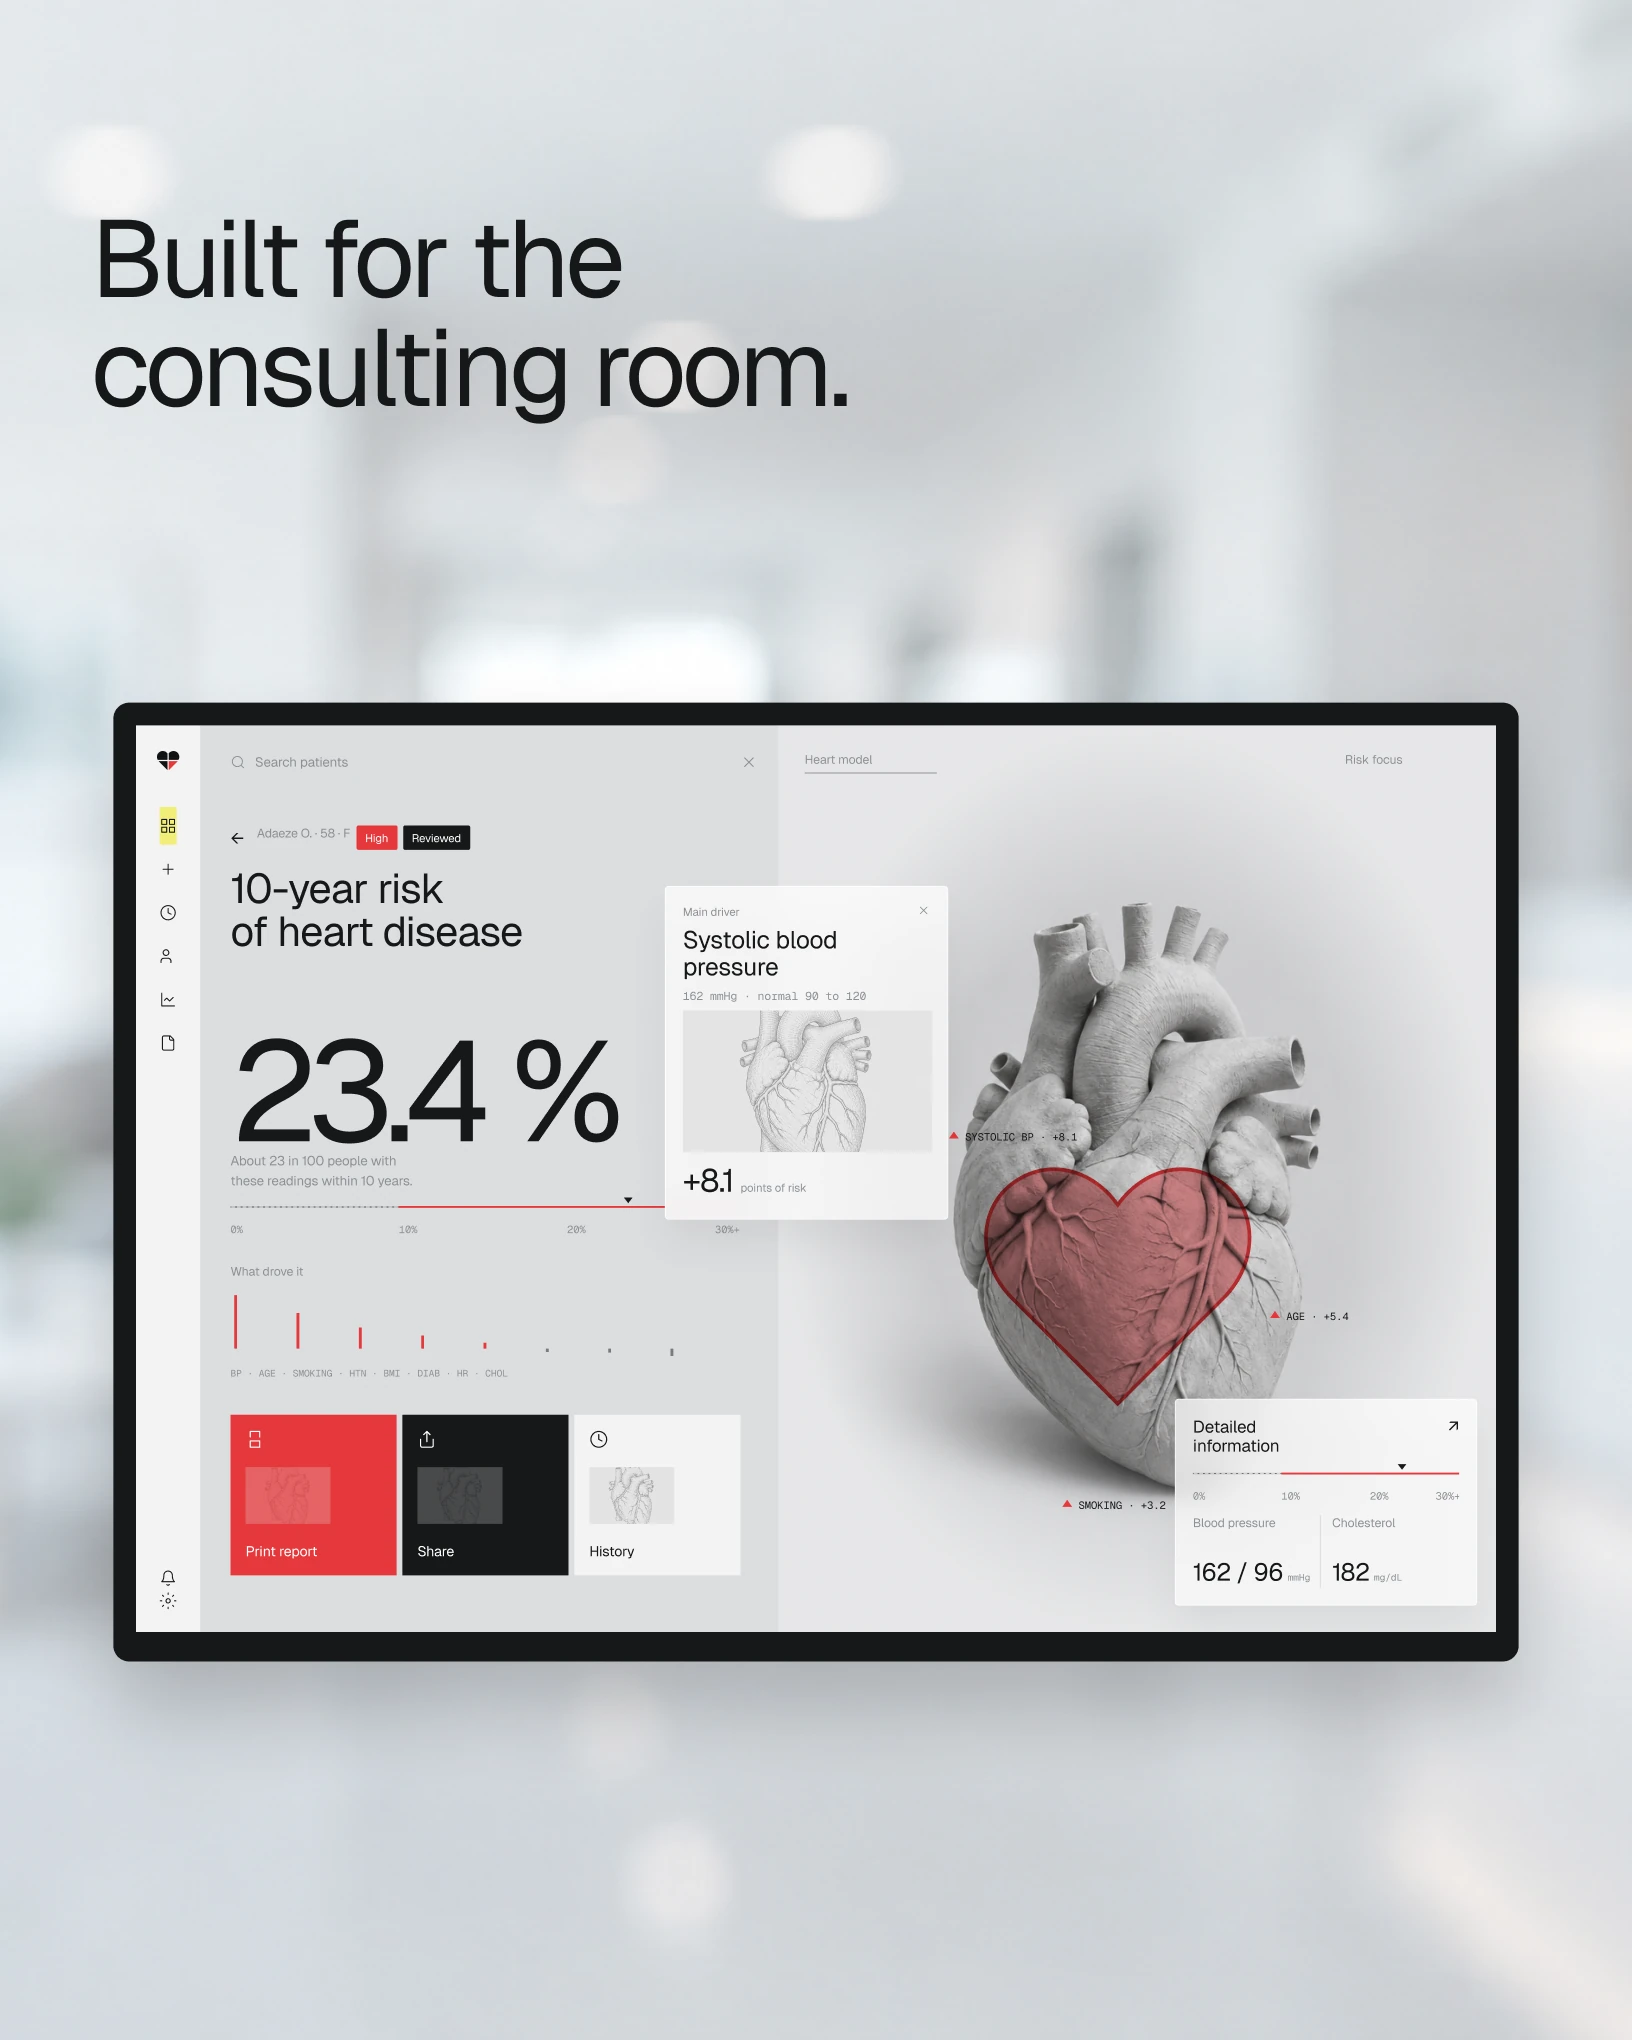
The original app worked: an XGBoost model that estimates 10-year heart disease risk from 15 inputs. We redesigned everything around one question: what does this number mean?





What we found
The model worked. Nobody could read the result.
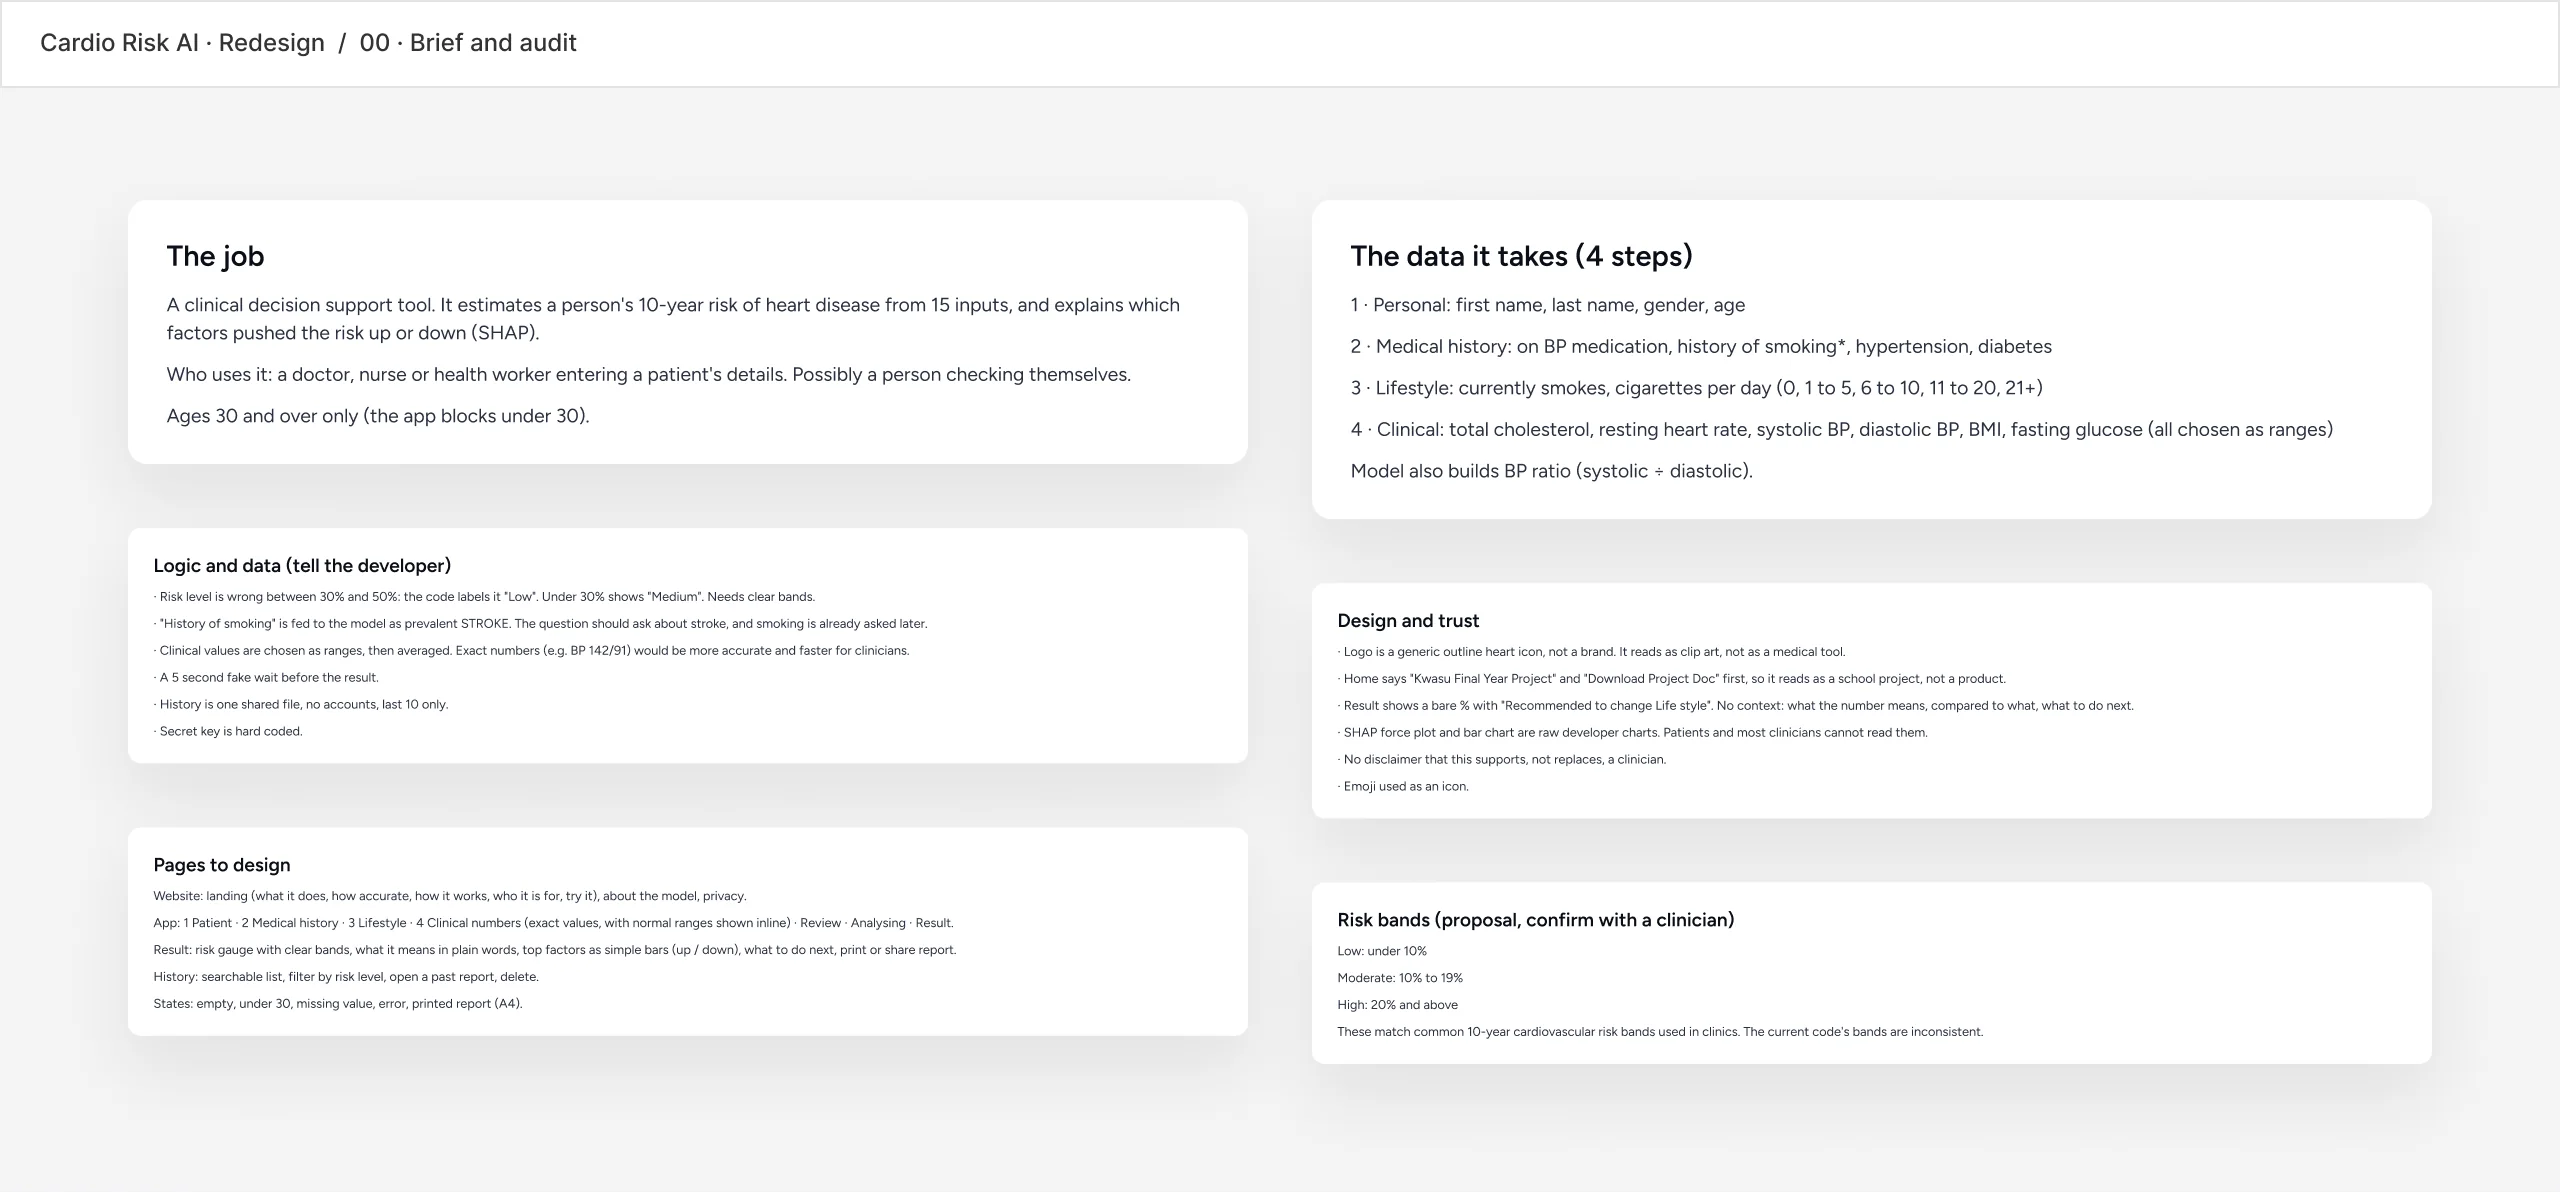
We audited the Flask app line by line before designing anything. Some problems were design, some were logic, and we wrote both down for the developer.
- A school project, not a product
- The home page led with "Final Year Project" and "Download Project Doc".
- A bare percentage
- The result was a number and "Recommended to change Life style", with no context and no next step.
- Bands that disagree
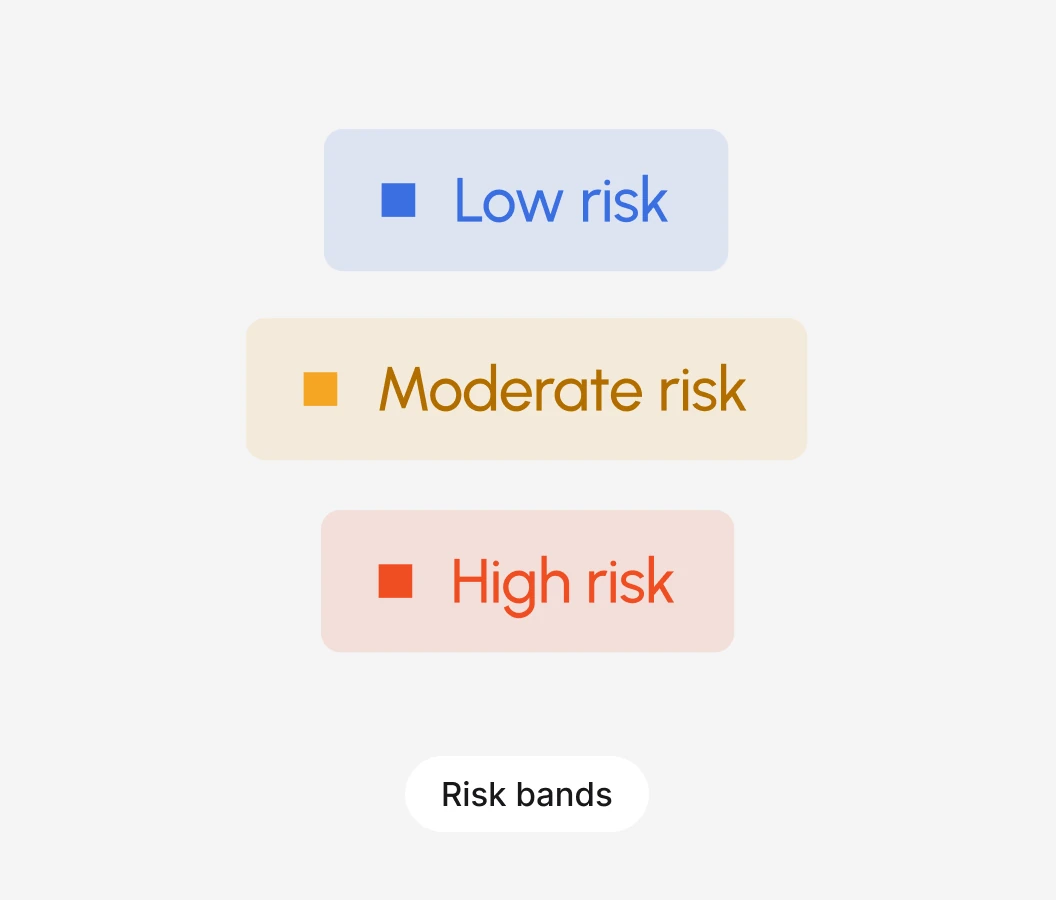
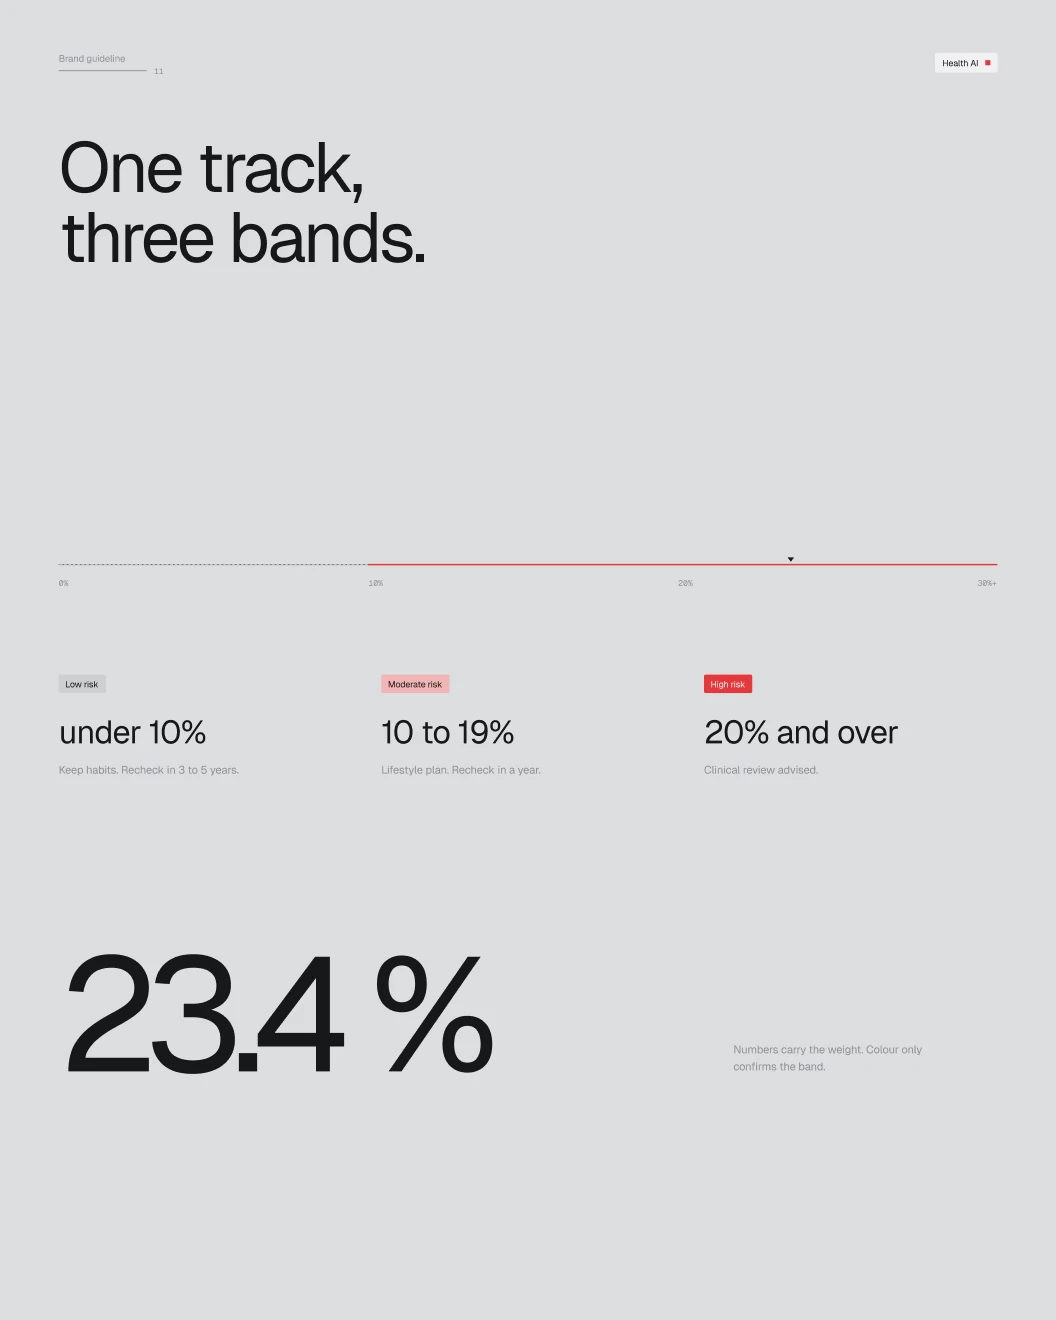
- The code labelled 30% to 50% as Low. We proposed three clear bands, to be confirmed with a clinician.
How it started
Every finding on one Figma page.
What the product does, the data it takes, what it gives back, the problems found, the new flow and the risk bands, before a single screen.
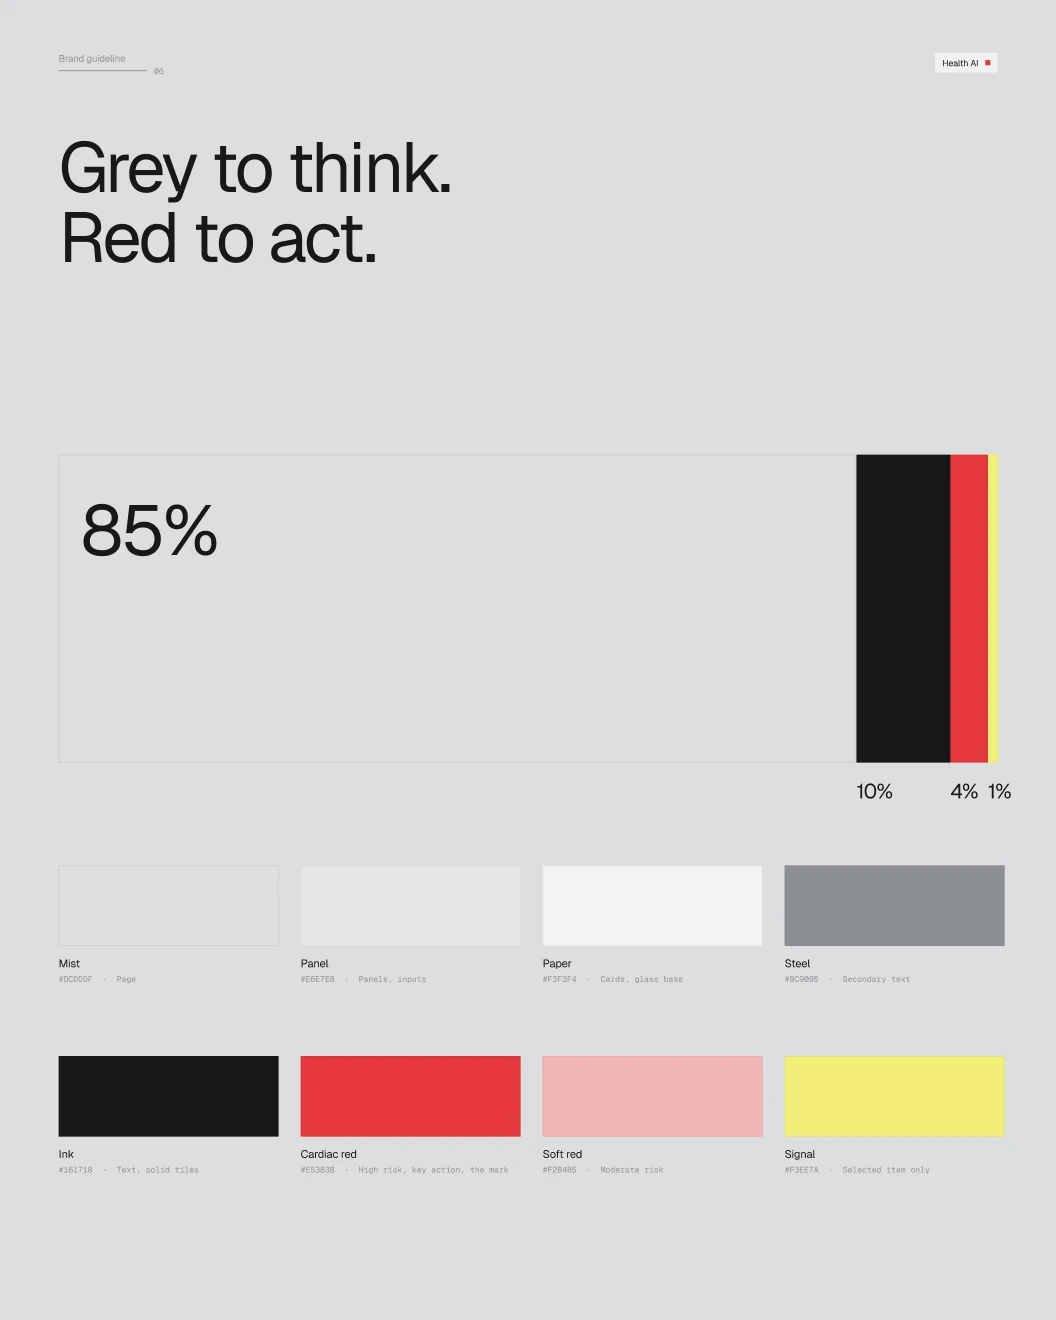
Grey to think, red to act
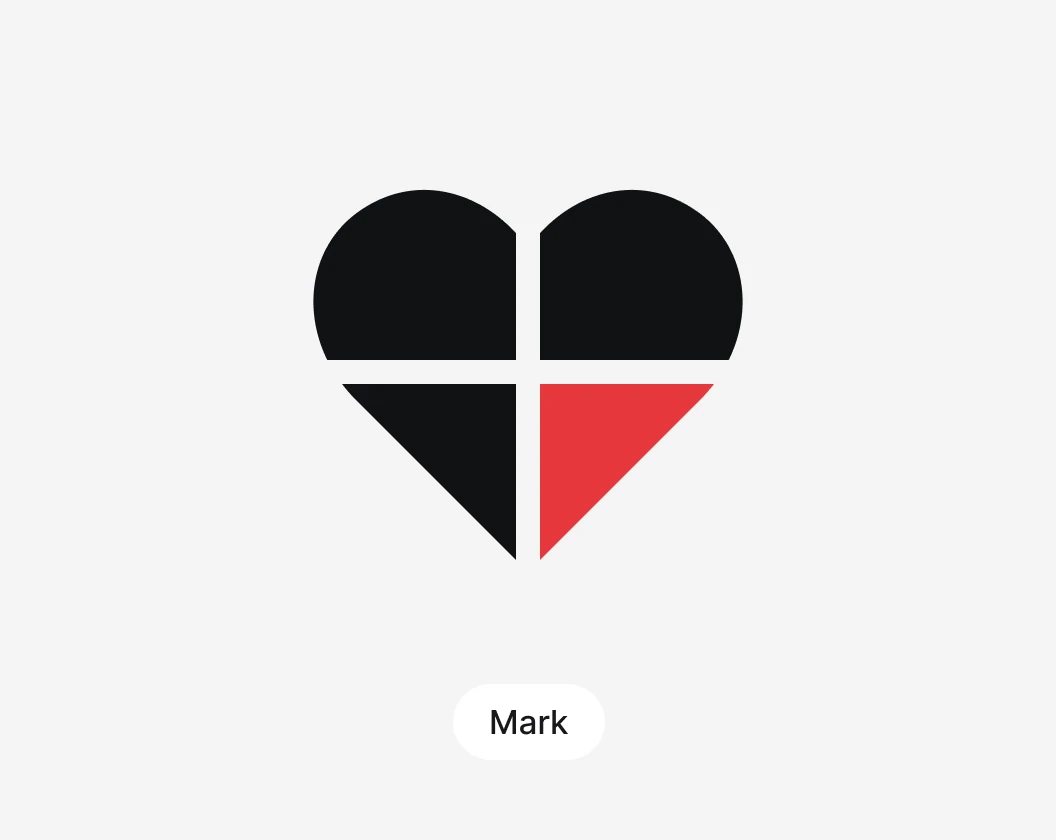
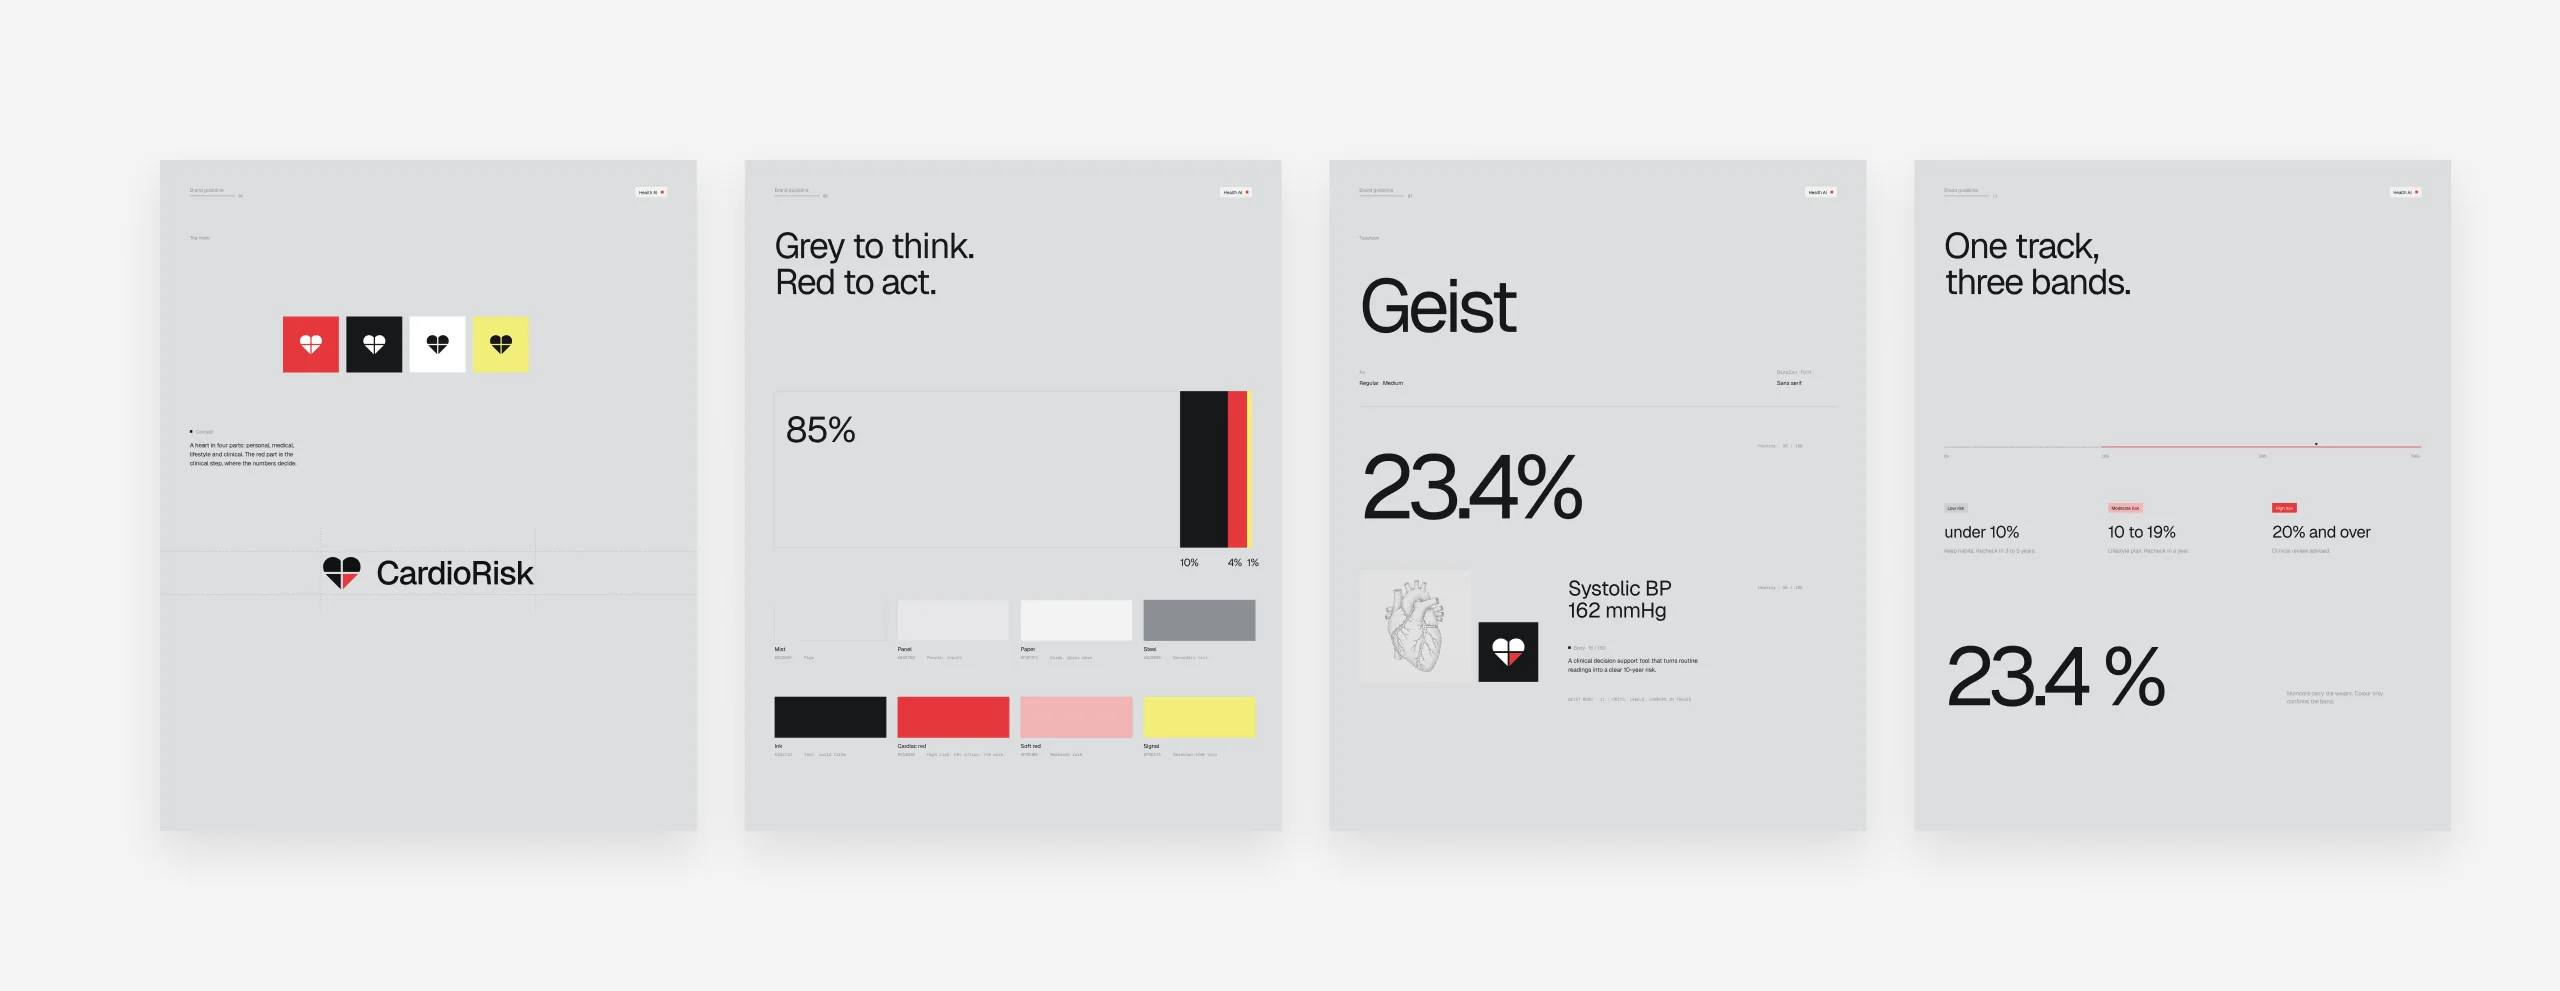
A heart in four parts: personal, medical, lifestyle and clinical.
The red part of the mark is the clinical step, where the numbers decide. Everything else stays grey, so red always means act. One typeface, Geist, with Geist Mono for units and numbers.
One track, three bands
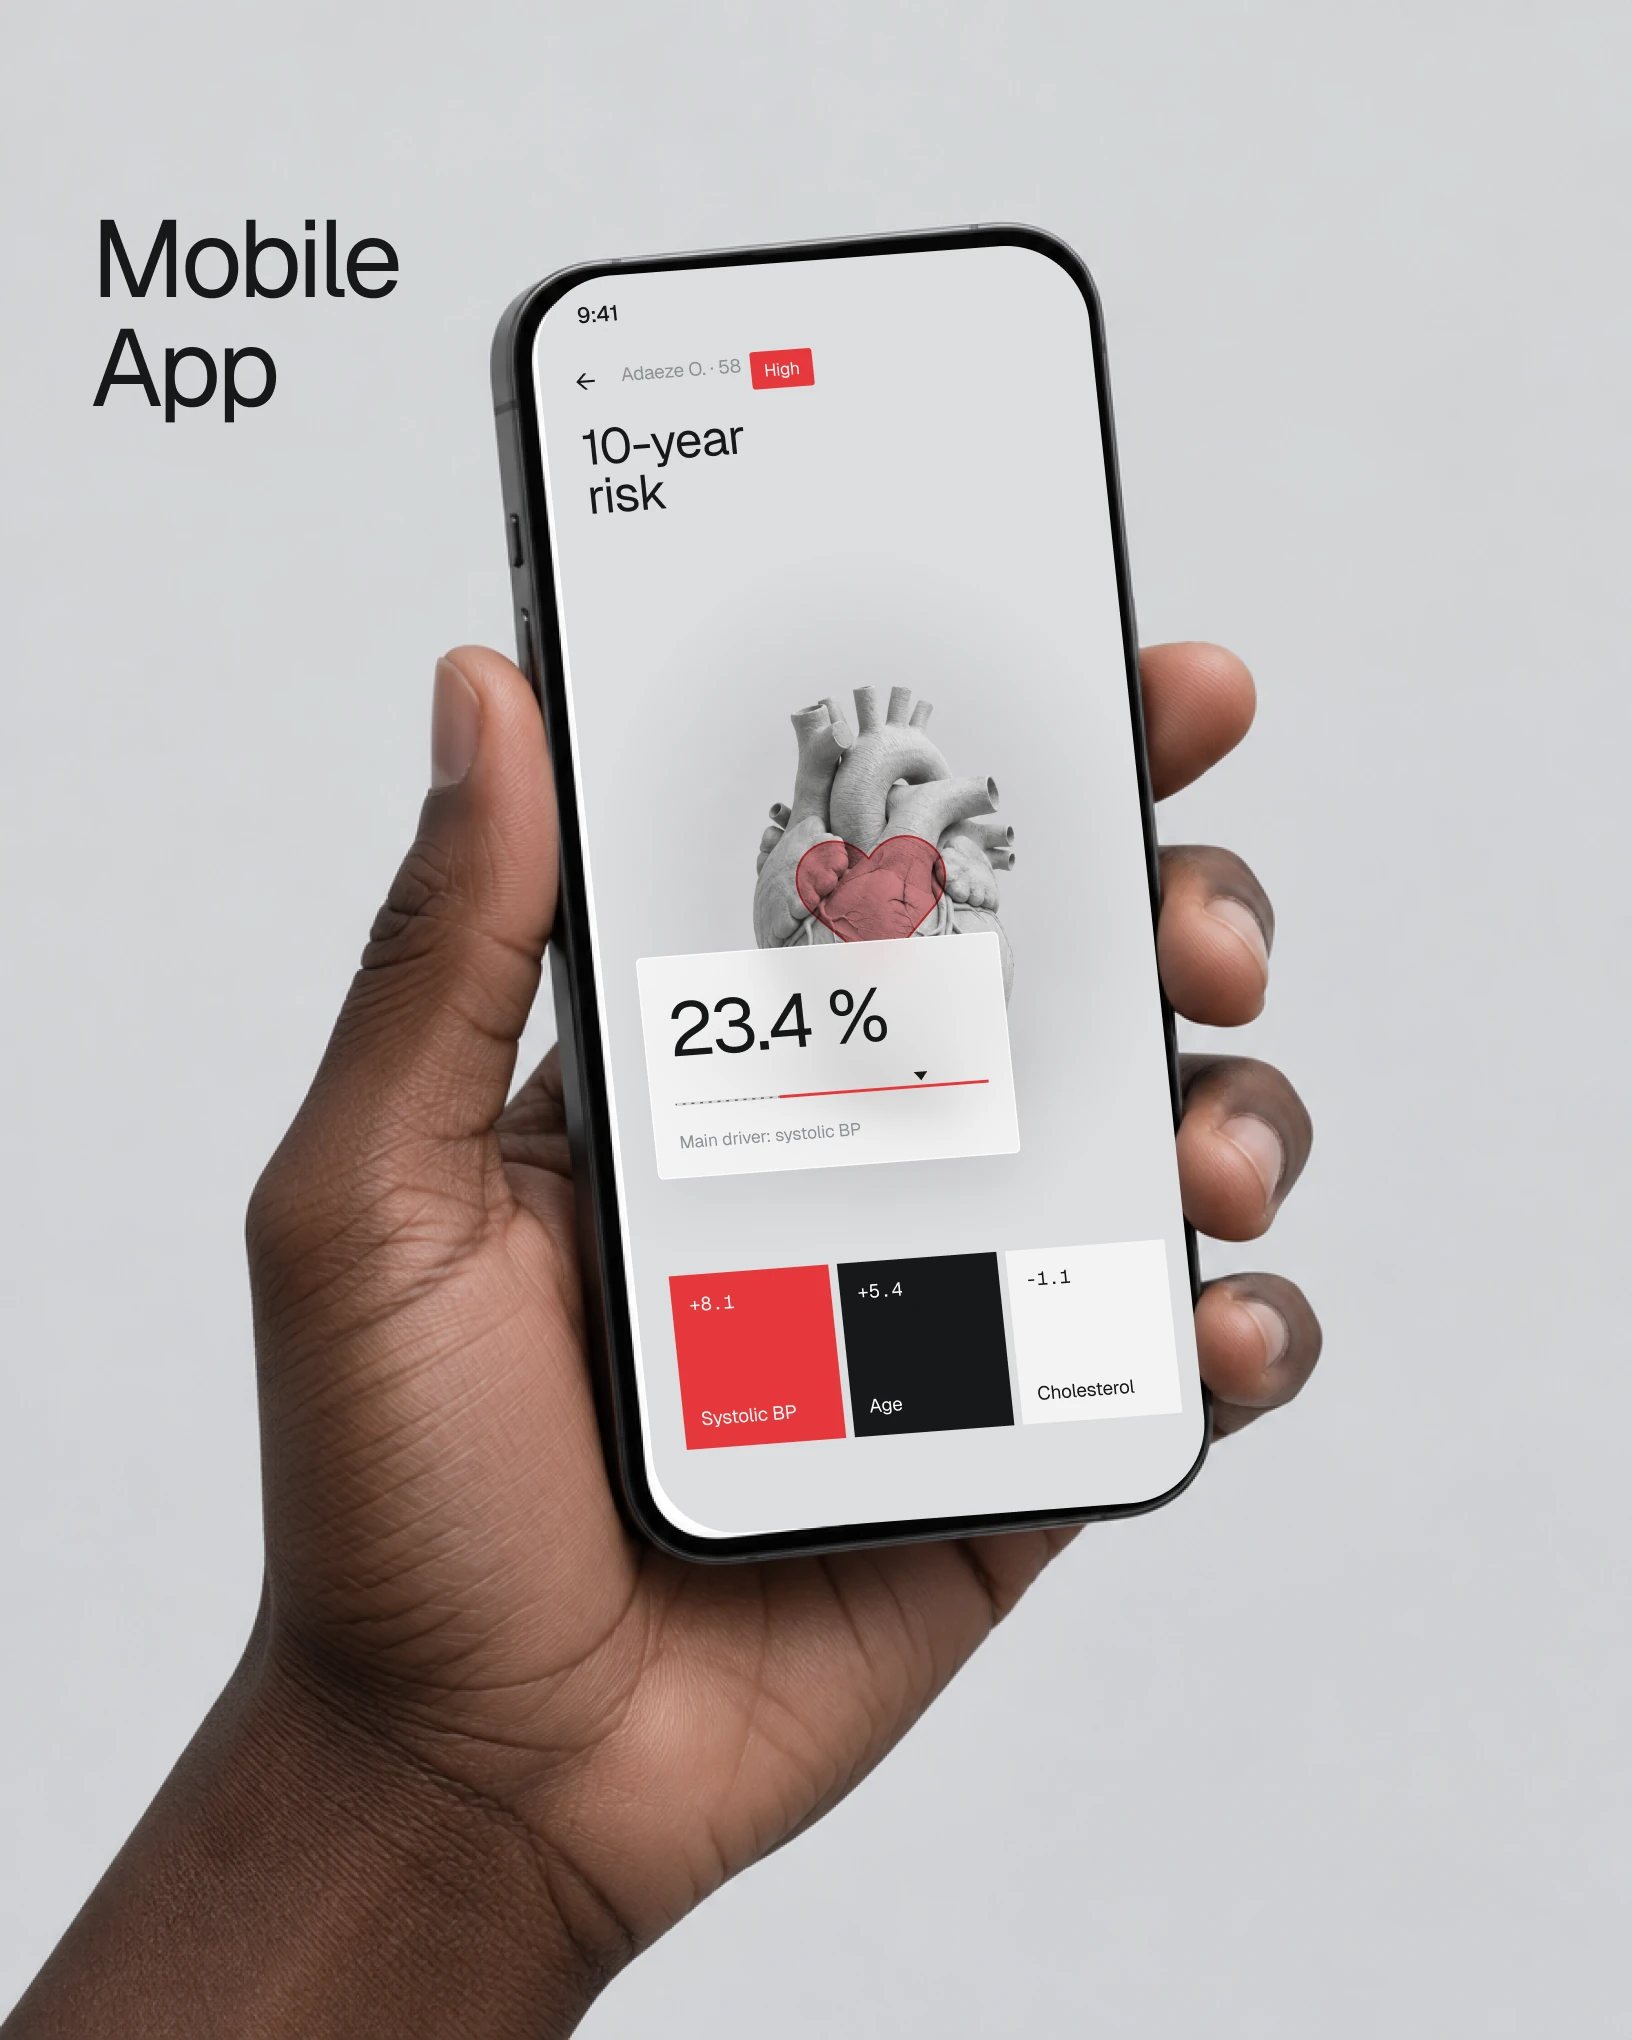
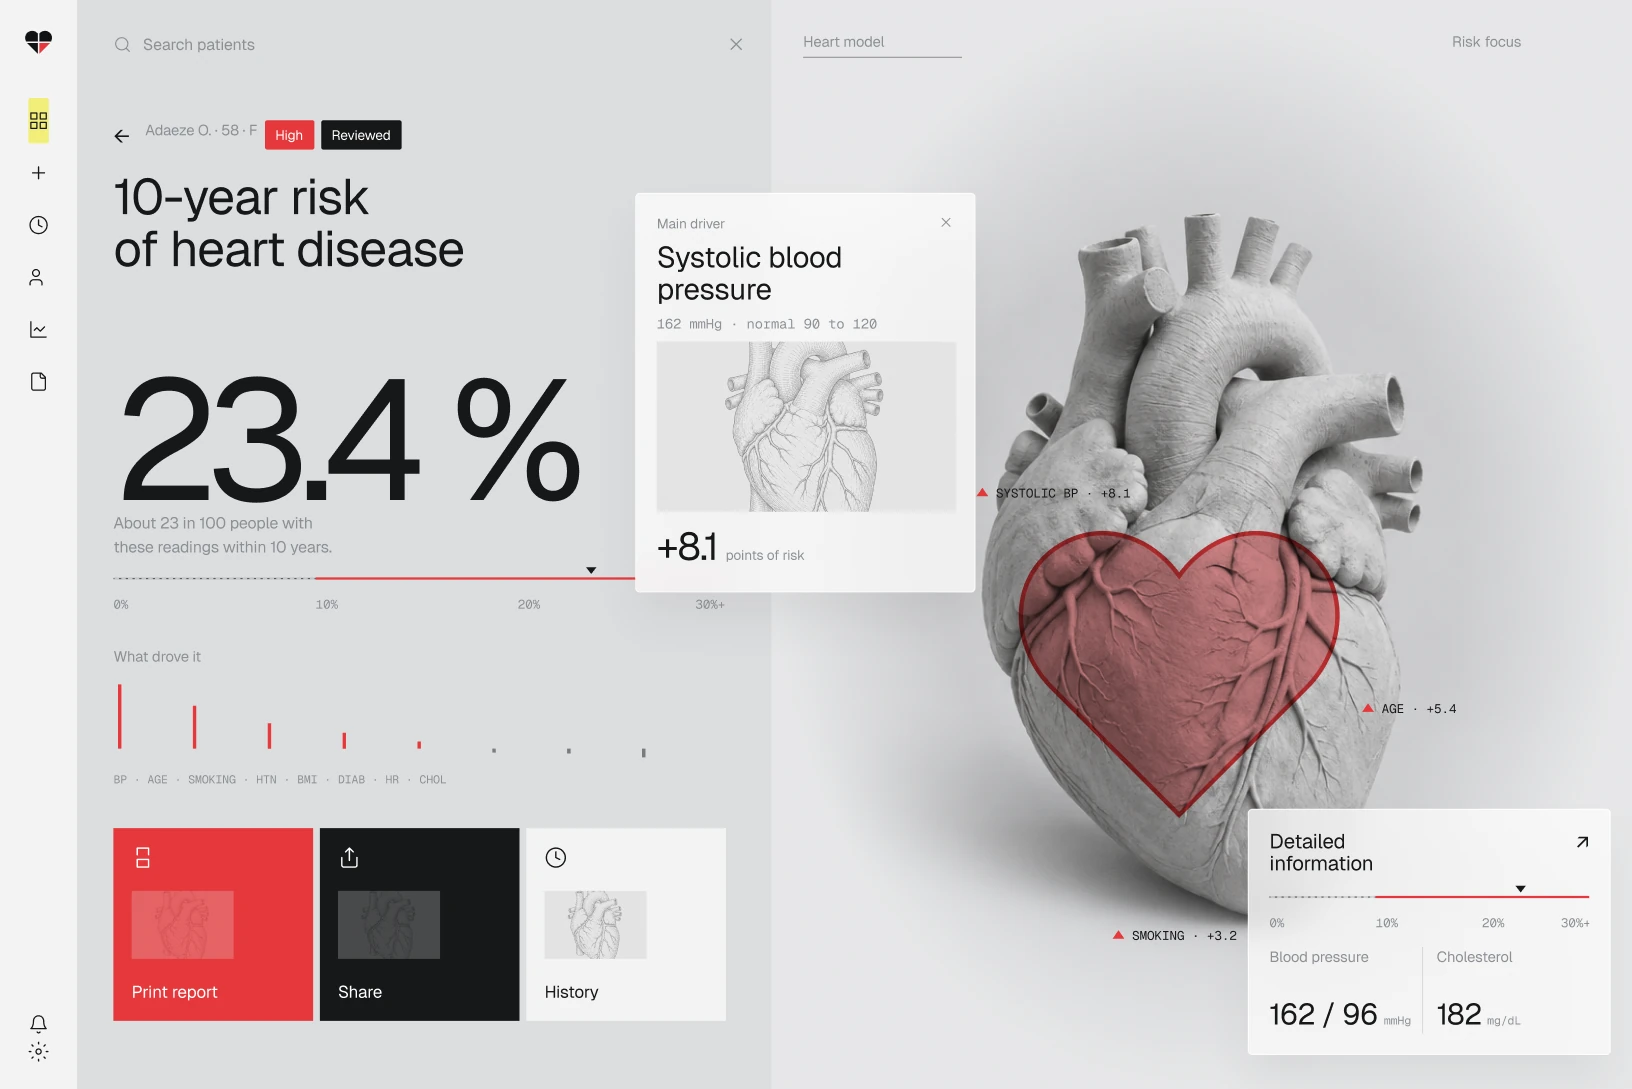
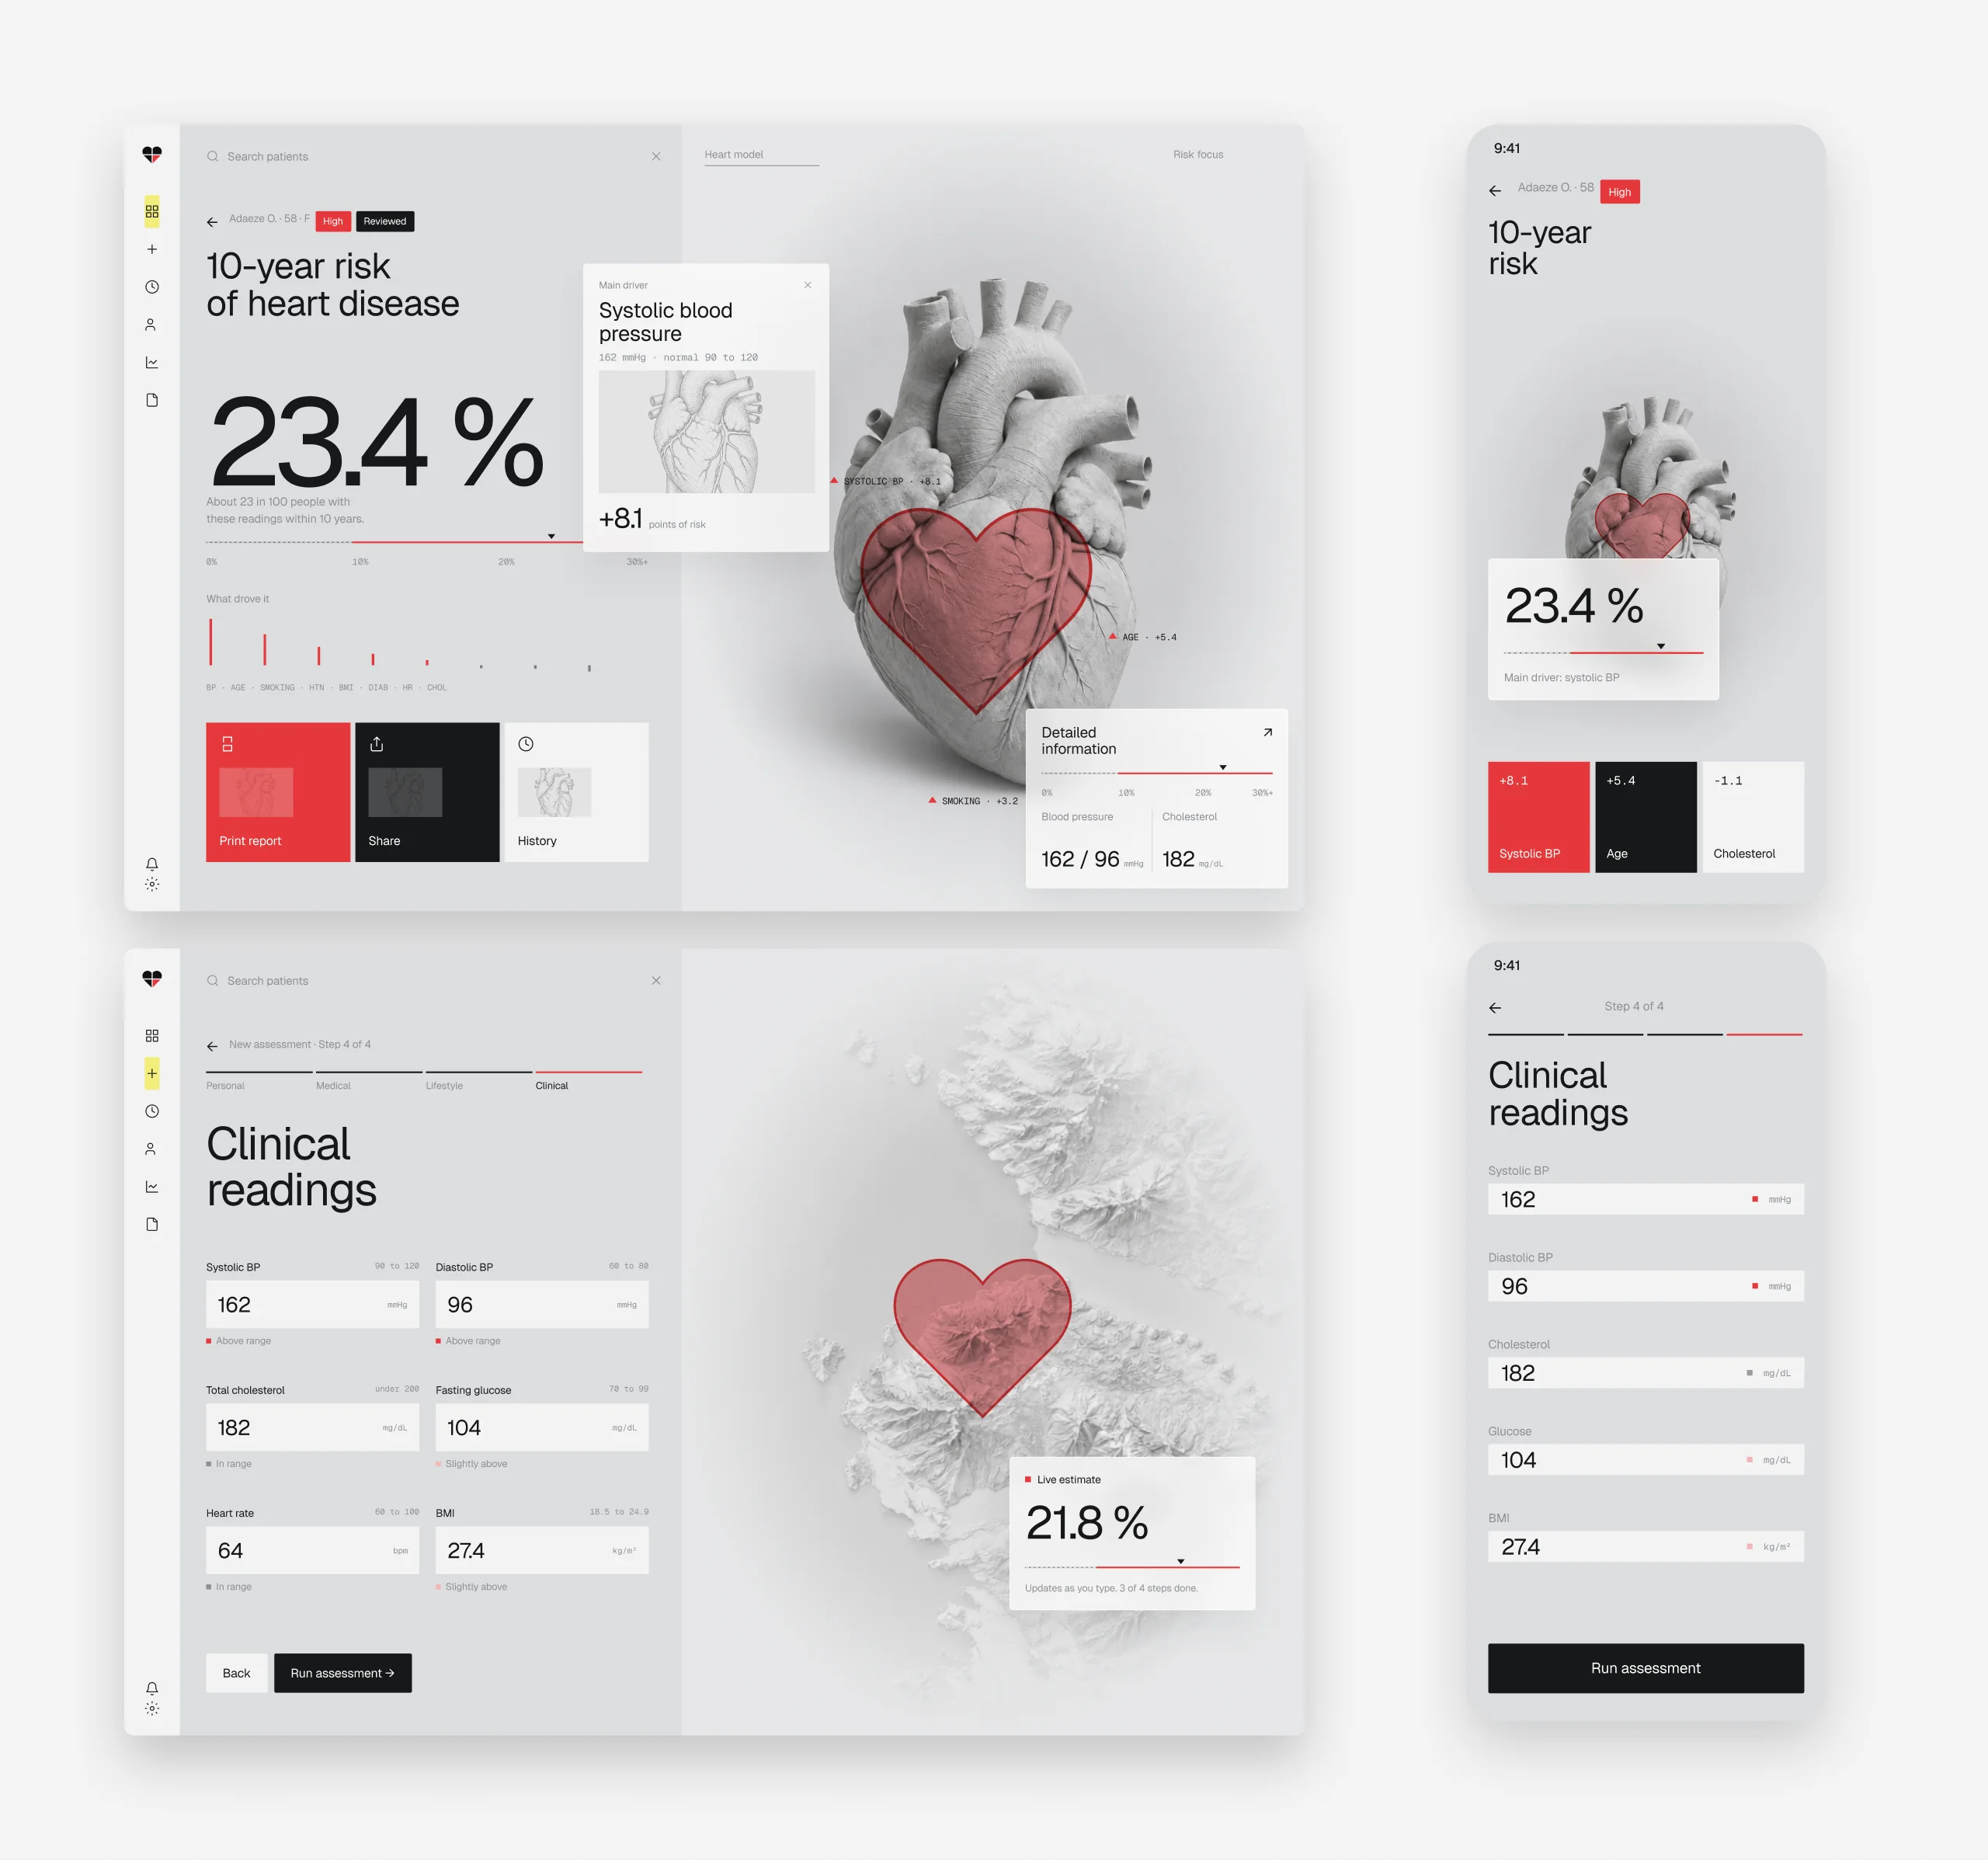
The result answers what the number means and what to do next.
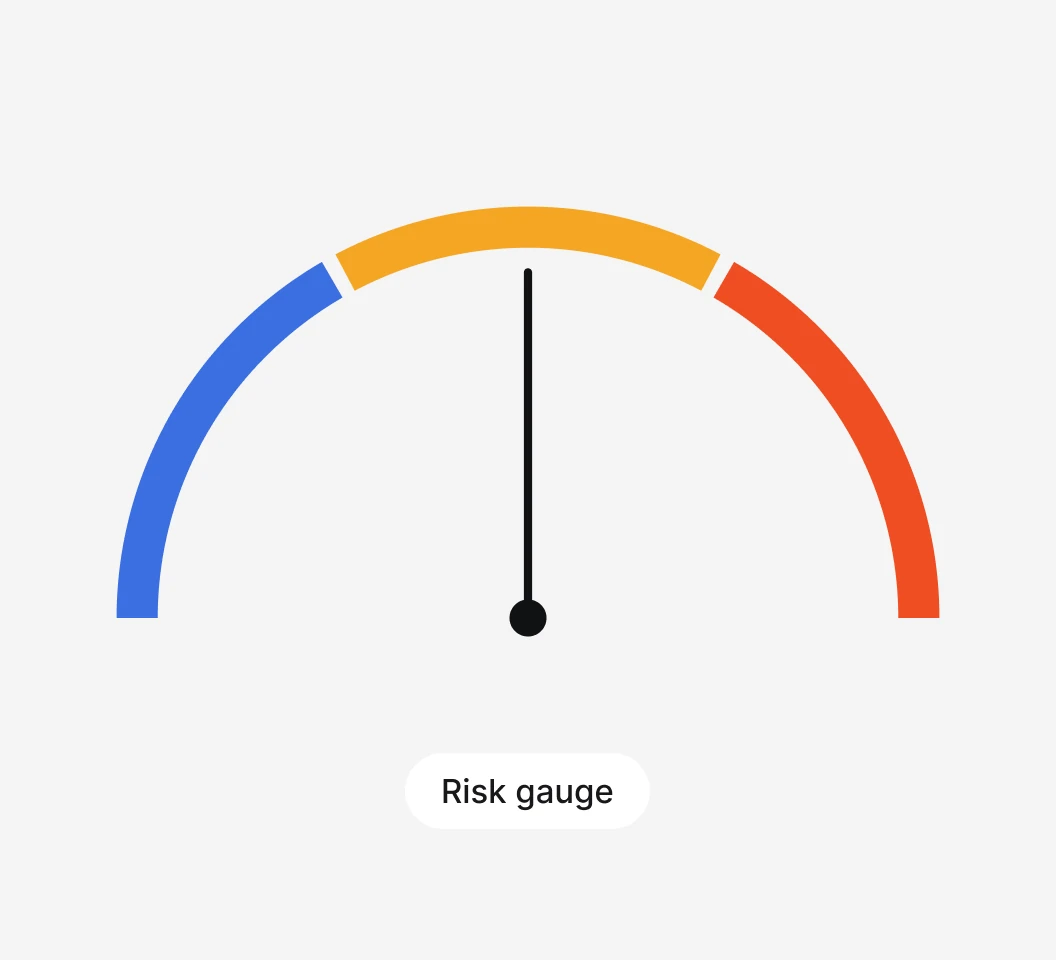
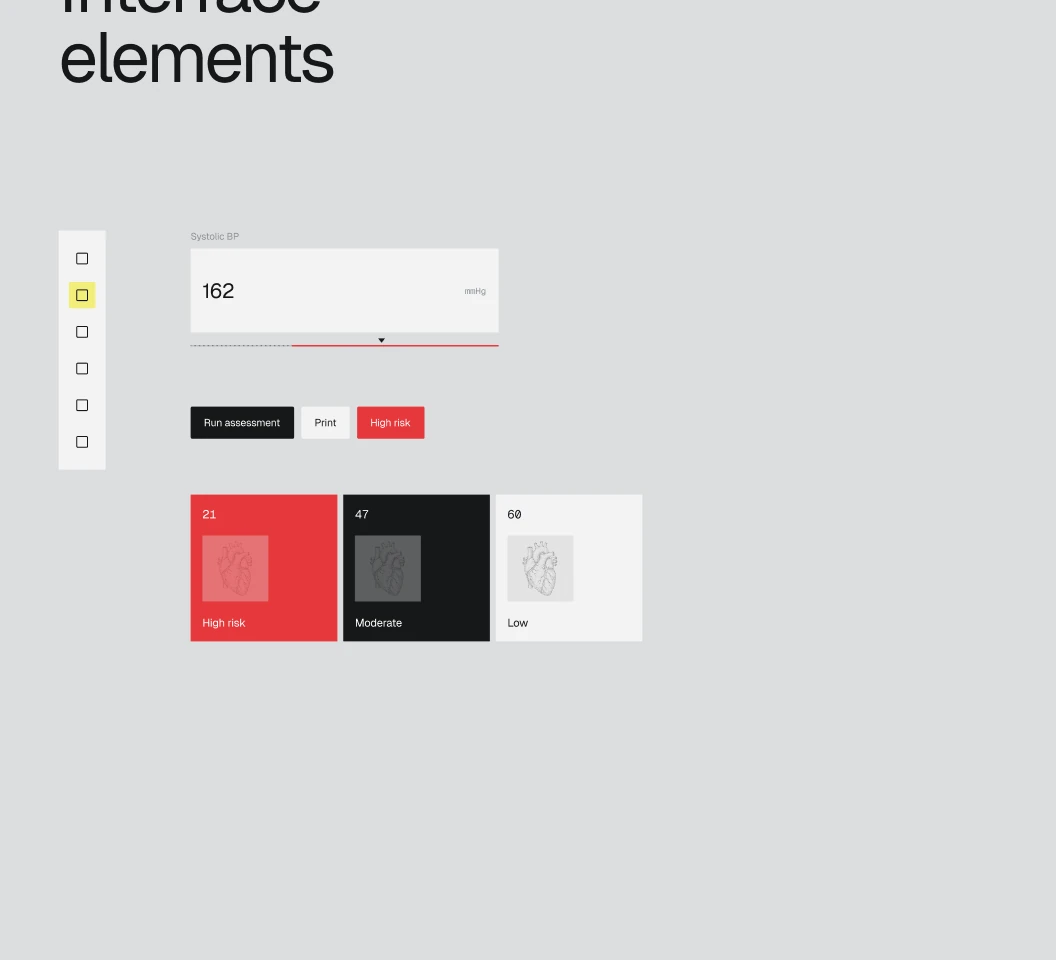
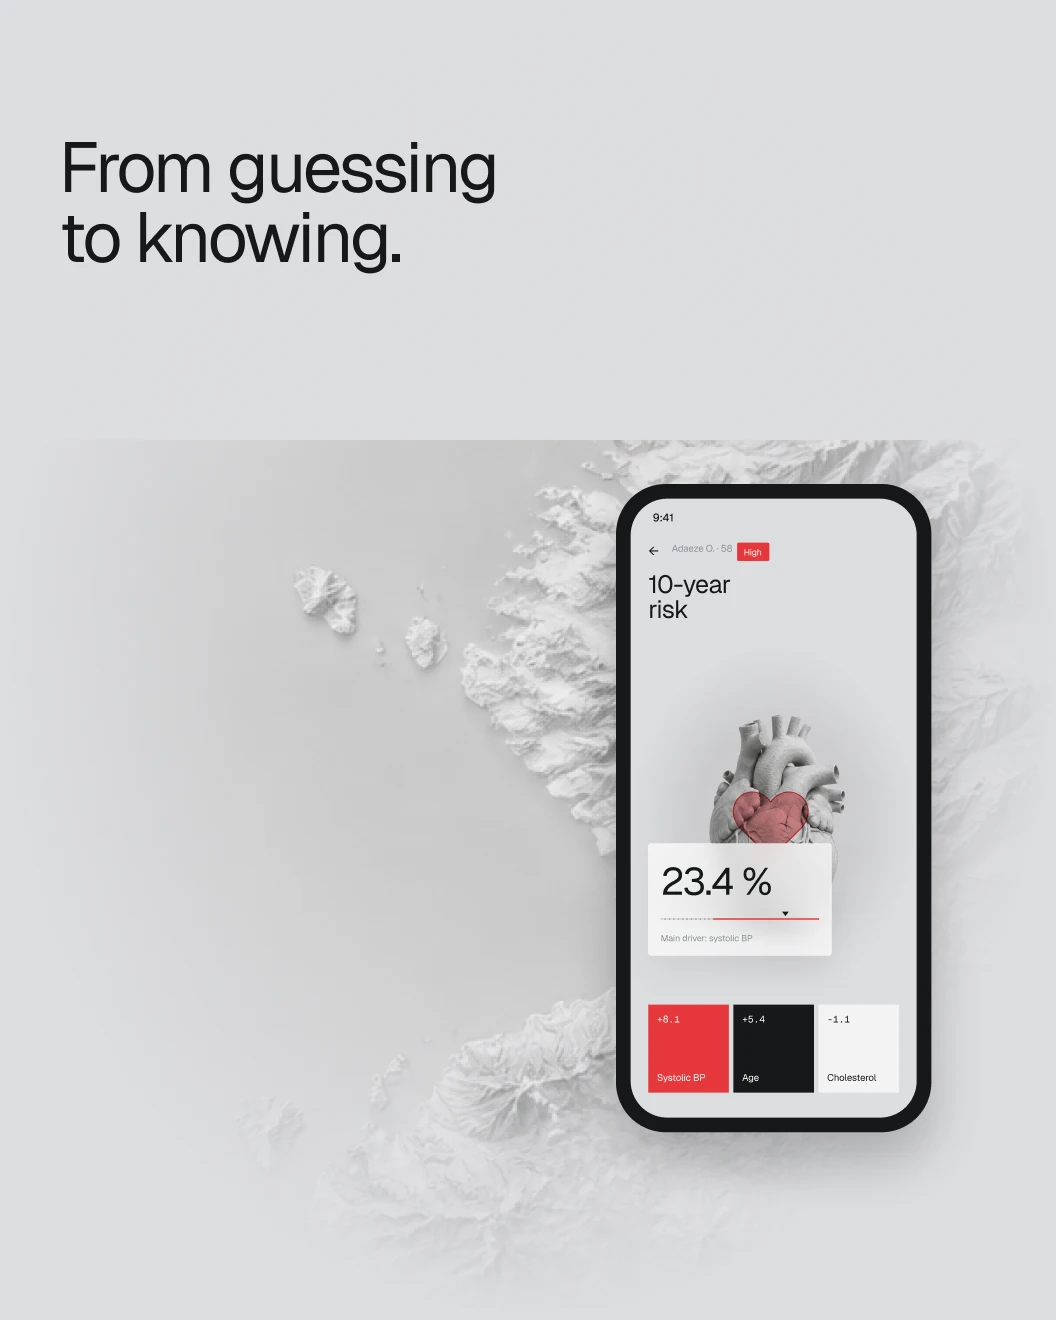
Four short steps with exact clinical values and normal ranges shown inline, then a risk gauge with clear bands, the top factors as simple bars and a printable report. History keeps past assessments a tap away.
The website
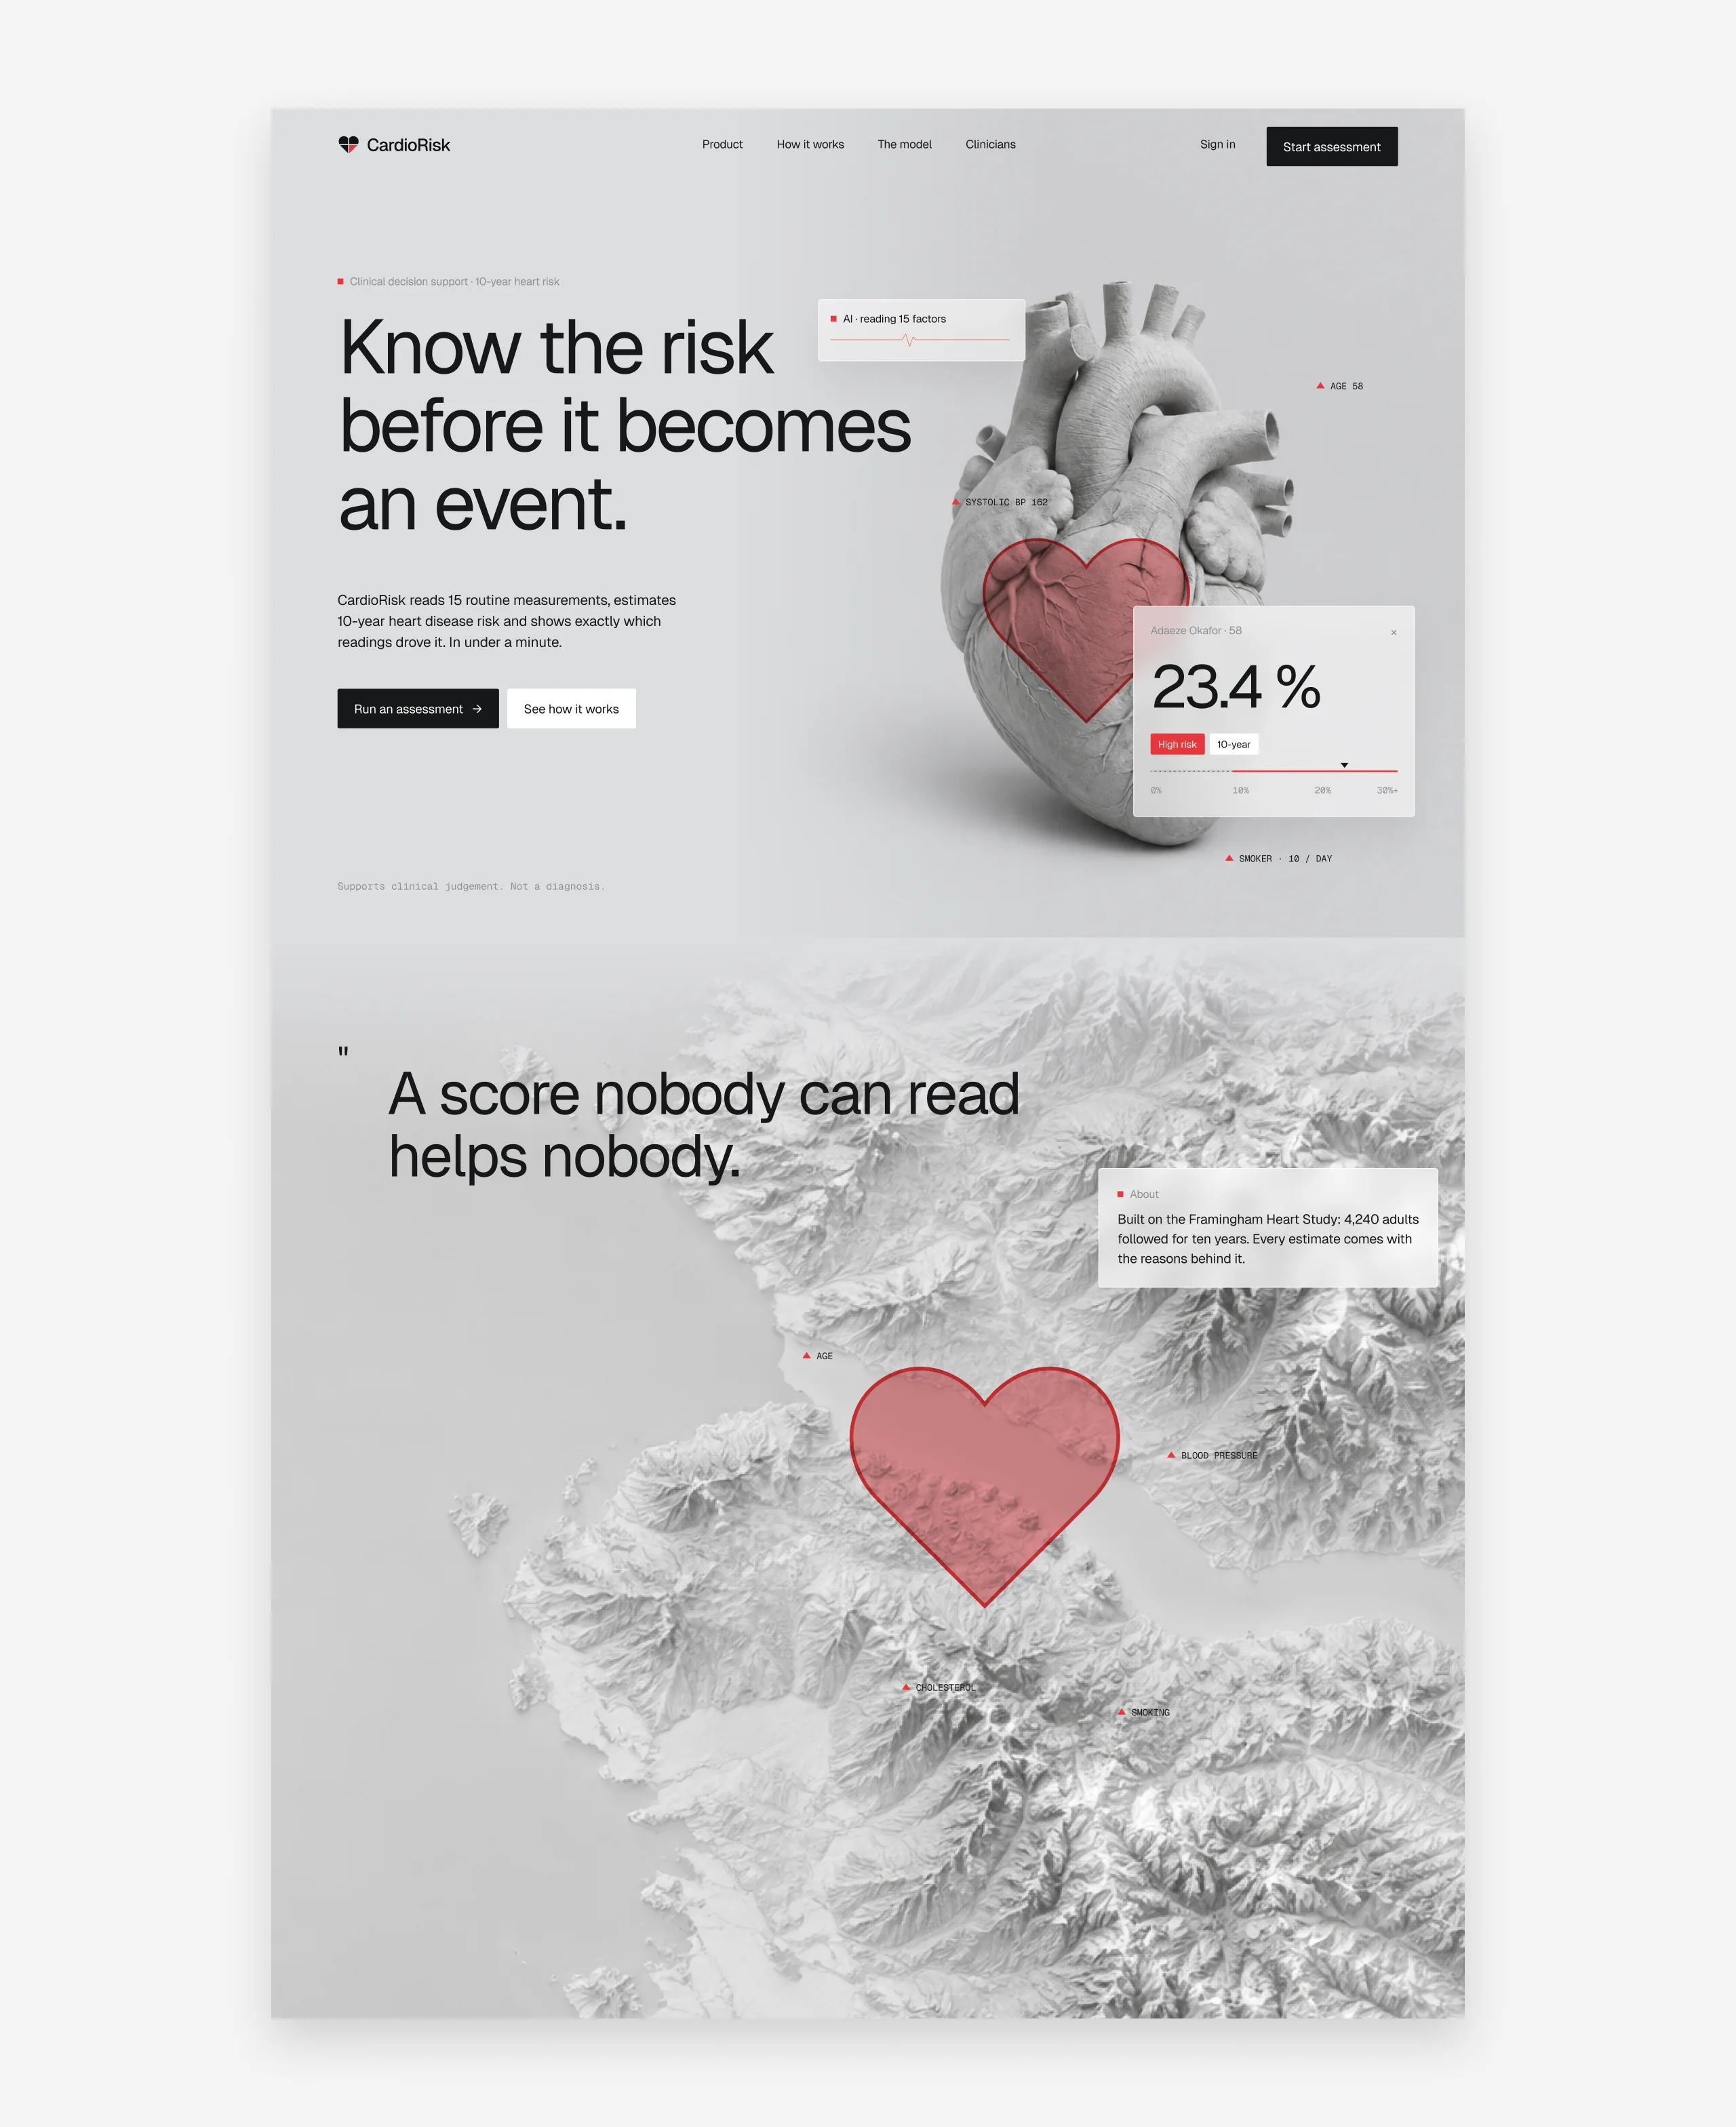
A landing page that explains before it asks.
What it does, how accurate it is, how it works and who it is for, then a clear way into the assessment.
Next case